The report from the Economic Policy Institute claims ‘CEO compensation has grown 940% since 1978 while typical worker compensation has risen only 12% during that time,’ stinks of yet another attempt to invoke populist envy.
Or you may have also heard about the CEO-to-worker pay gap rising from 21 to 1 to 400 to 1 since the 1970s, is any of this actually true, and if yes, why?
Let us look at these claims one by one. Let’s start with the low rise in workers’ compensation since the 1970s of only 12%.
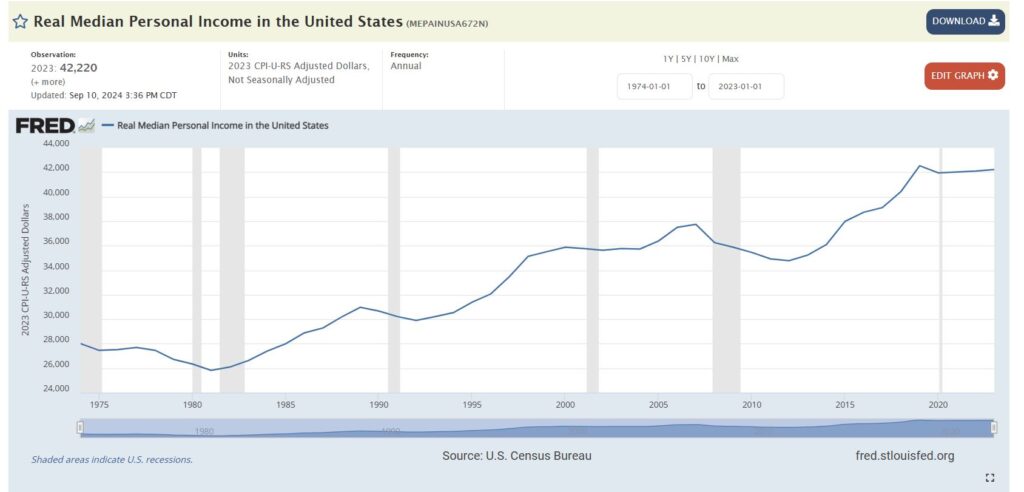
Only a 12% rise in compensation since 1978 for a typical worker if true, would be a concern in itself, without even looking at the CEO numbers. However, as other studies that have claimed a low rise in income for middle or lower-class workers, this study understates the numbers by only looking at wages. Since 1978, total compensation has moved away from wages, and has included a number of benefits such as healthcare, and guess what, equity sharing. Even Walmart cashiers can be part of equity-sharing accounts these days. This is the main trick that is used to understate the growth of worker compensation. The real median personal income has grown by over 60% since the 1970s.
https://fred.stlouisfed.org/series/MEPAINUSA672N
Now let’s investigate the claim about CEO compensation. The first thing you should know is that the CEO pay numbers that these studies are looking at are not the average CEO pay but rather the CEO pay of the top 500 CEOs in the country. They are taking the companies from the S&P500, or what essentially are the top 500 companies in the US, and averaging out the pay of those CEOs. Then comparing that pay to an average worker. This is how they come to and calculate the 400 to 1 pay gap ratio.
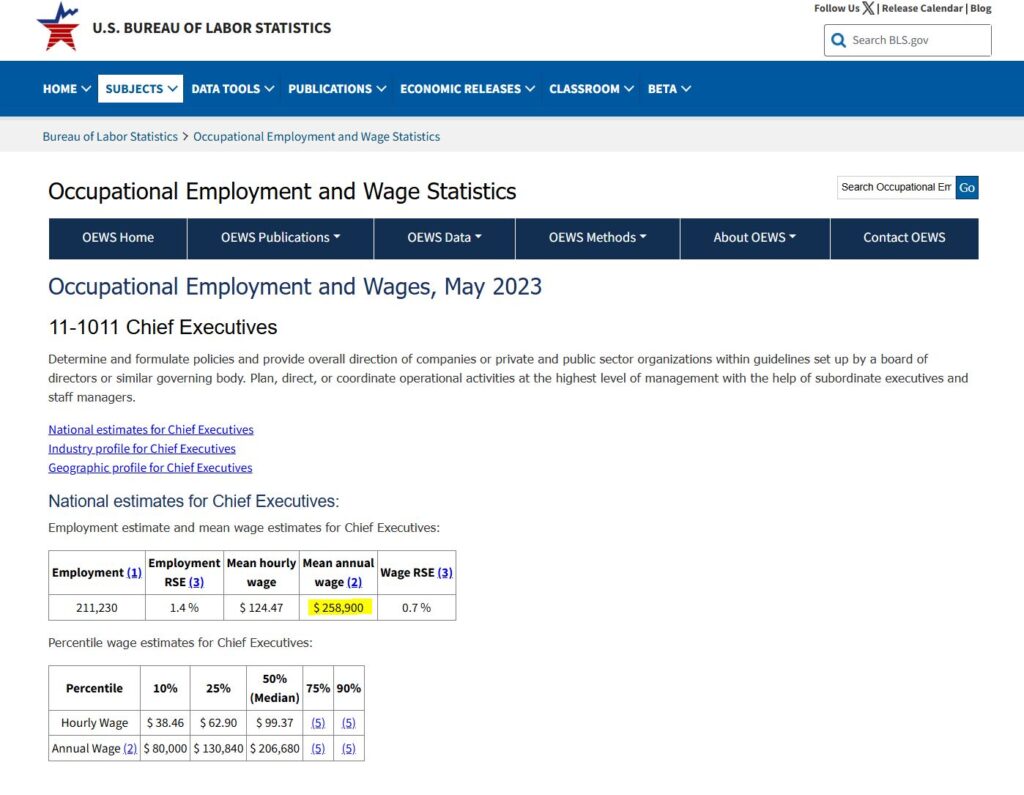
The truth is that the average CEO pay in the US is actually about 260k, while the average worker pay is 60k, a 4 to 1 ratio, not 400 to 1, when comparing apples to apples. These numbers come from BLS, if you are worried about bias. The top 500 CEOs of course make somewhere around 20 million dollars a year on average, but if we compare them fairly to top workers in the same companies, there are also top engineers that make millions of dollars a year.
But let’s be fair here, the analysis is also looking at the change in the pay gap since 1978, and claiming a very large rise in the gap. However, the way they come to this calculation is not exactly true either.
The first thing we should do is just admit to ourselves that in part, this is just a mathematical thing, a fact of reality that the best of the best are always improving and setting new records, while the average moves up slower simply due to the fact that it is the average. This is true in anything and everything. The top Olympic scores are always improving, while the average is staying about the same. Top actors are more talented, get paid more, top NBA players score more, even the gap between the top worker, the top engineer, and the average worker/engineer has no doubt increased substantially.
However, this is not the top factor or contributor to the rise in the CEO to worker pay gap. The main factor is the change in the CEO pay structure. In the 1970s companies wanted to align the executives’ interests with the shareholders, and thus began the trend toward greater use of equity-based compensation for CEOs. CEOs began to be compensated with stock. Given this trend, the regulatory environment also changed, requiring more detailed reporting of stock options and equity for CEO compensation. So one factor for the CEO to worker pay gap being smaller prior to 1978 is the simple fact that stock compensation was simply not reported.
Given that the majority of CEO compensation today is tied to the stock market performance, the next step for inflating CEO pay and thus the pay gap ratio should be obvious, pick a good year for the stock market. When you pick a good stock market performance year, obviously CEOs who are mostly paid in stock are going to have an inflated compensation. But the stock market is very volatile, and as a result so are CEO compensation levels. It is actually quite common for CEOs to see negative compensation. If for instance, you would use the year 2002 as a data point, or really any other bad year for the stock market, you would find that 40% of CEOs actually lost money.
You would think that the left, who tends to be the side propagating these numbers to invoke populist envy would be happy the CEOs today are being paid in stock, because this means that the majority of their compensation is not coming out from company income, which means more is left for the workers. I don’t think anyone even realizes this fact honestly. When a company compensates a CEO with stock, they issue new stock. This costs nothing for the company, and the value of that stock is taken from the value of the stock held by the current shareholders. Basically, what the issuance of new stock does is dilute the value of existing shares in the market. From the perspective of the left, who keep claiming that CEOs are compensated with the value created by the workers, this should be a great thing, the CEOs are actually being compensated by the value of other shareholders.
Let’s take Jeff Bezos as an example. Famously Bezos only paid himself a salary of 80k. His billions come from the appreciation of the value of the stock he owns since the creation of the company. If he wants to realize any of his billions in actual cash he has to sell the stock, and there has to be an existing shareholder, or perspective buyer who is willing to give him cash for this stock. This means the people paying Bezos are not the workers of Amazon, but other shareholders, or other stock traders who want to acquire Amazon stock.