I say that nothing happened in 1971 because productivity and compensation is not delinked.
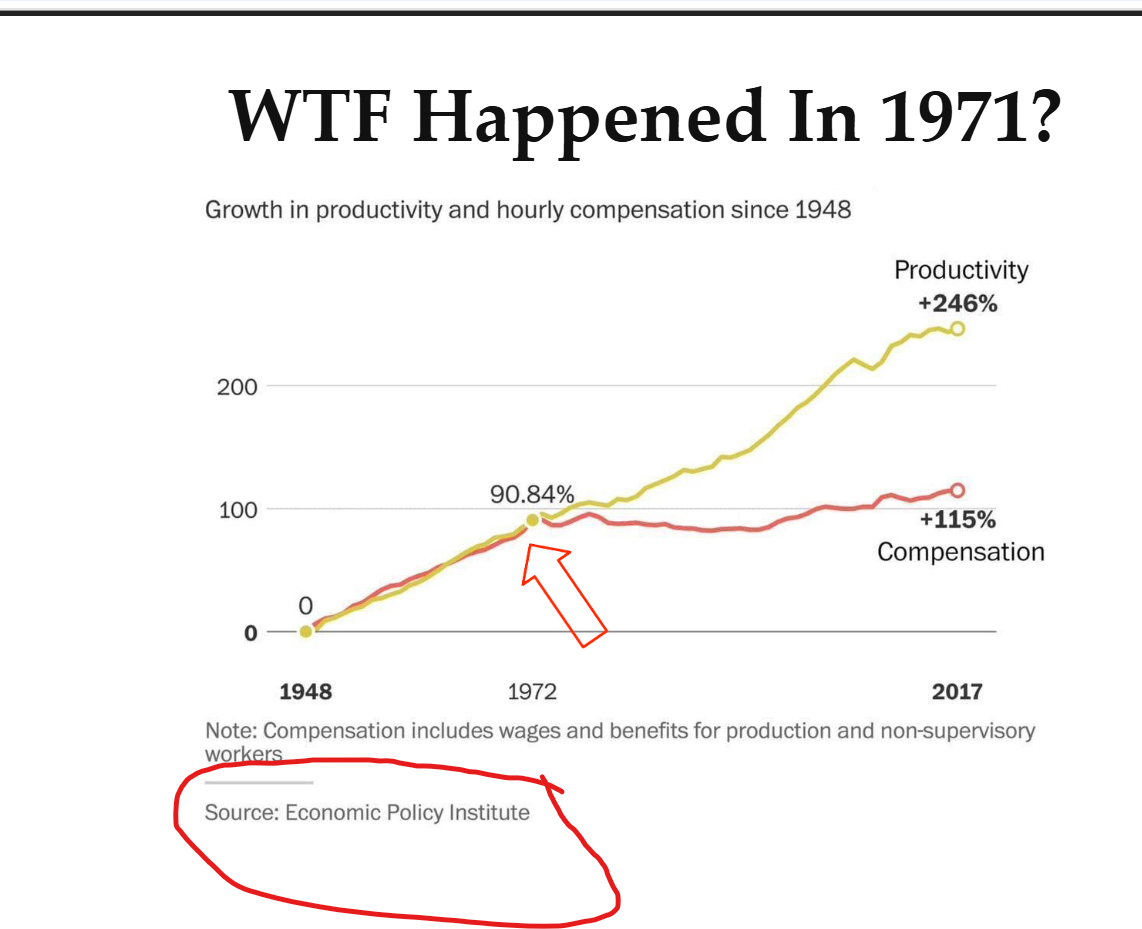
The truth is that the above graph is fake. Made in 2012 by a leftist think tank, the Economic Policy Institute, popularized and shared by Senator Elizabeth Warren, and was almost immediately debunked. But that hasn’t stopped EPI( Economic Policy Institute) or anyone from continuing to share to this day.
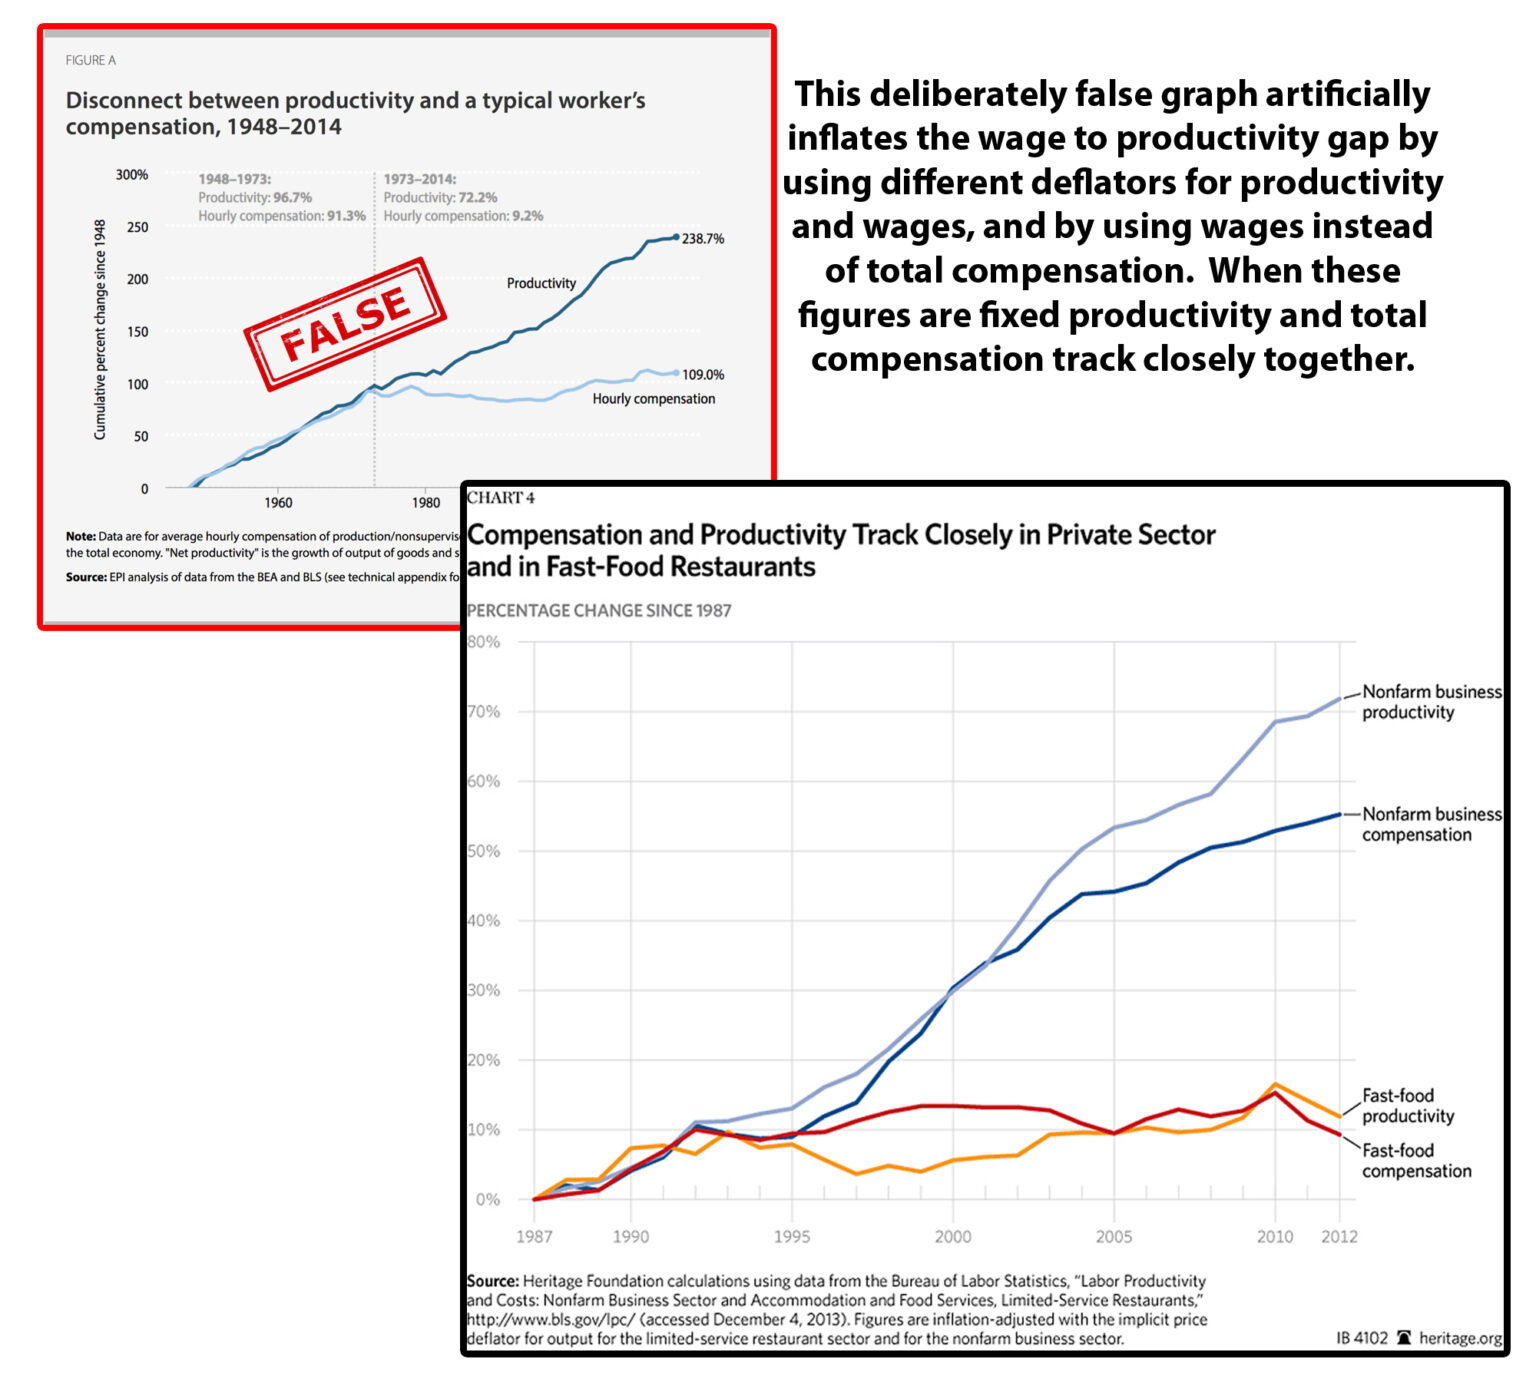
In their fake graph EPI deliberately inflates the compensation to productivity gap by using different deflators for productivity and wages, and by using wages instead of total compensation. Using wages instead of total compensation doesn’t capture the total incomes of today’s workers, since compensation has moved toward more benefits since 1970s, an using different deflators to adjust productivity and compensation for inflation is just outright fraud. They essentially sat down and said, let me adjust this number with this inflation index and this number with some other one, and see which one causes the biggest gap. When these figures are fixed productivity and total compensation track closely together.
Another inconvenient truth about productivity is that no all sectors experience the same productivity growths. Manufacturing for example has had a lot of productivity growths, while the fast food industry has not. Productivity and compensation in the fast food industry track almost perfectly.
I think before we continue it is important to also highlight why someone would want to deliberately fabricate a a compensation productivity gap. You see leftists, but really all statists, destroy free markets and destroy capitalism by establishing controls and taxes that tie industries hand and foot, resulting in them not being able to fix their own problems. Once an industry is sufficiently tied and a problem arises, they claim that the free market has failed and more or stronger controls are necessary. They feed on problems and on suffering, it’s their only its only means of self-perpetuation. When no problems or suffering can be found, they are are compelled to invent or manufacture them. This is exactly what EPI does, they manufacture a non-exist problem, and call for government controls on wages, profits, higher taxes and a plethora of other debilitating economic policy that will only create more problems.
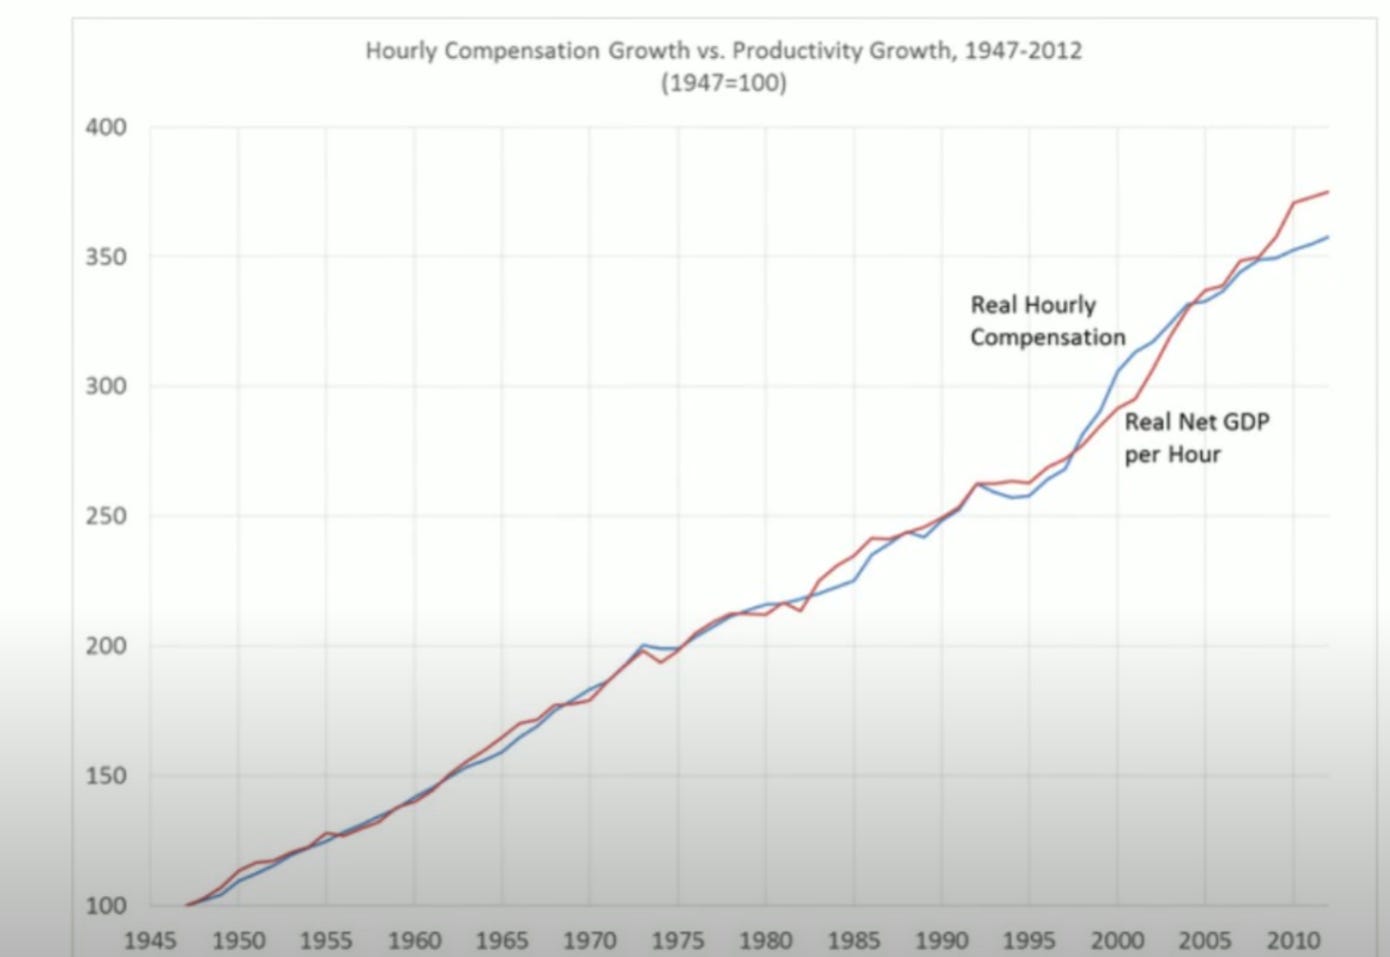
As shown on the fixed graph, using the proper deflator (inflation adjustment) and incorporating total compensation explains about 60% of the productivity compensation gap that seems to have grown since 1971. But the fact of the matter is that the remaining 40% can be explained as well.
Firstly productivity can be significantly impacted by foreign imports becoming cheaper. This appears as a worker productivity increase, but it is really due to trade. And secondly, the modern heavy reliance on computers, which quickly become obsolete has increased the capital depreciation rates as compared to 1970s when firms would invest in capital like buildings and machinery. We can easily adjust for both and when we do, compensation and productivity track almost perfectly.
It is understandable that you might be suspicious of this analysis given that it was primarily sourced from the heritage foundation. So I will add a similar corroborating analysis from Bureau of Labor and Statistics (BLS).
BLS finds a small gap developing between productivity and compensation. They find that on average producivity has grow 2.2% per year while compensation only 1.7%.
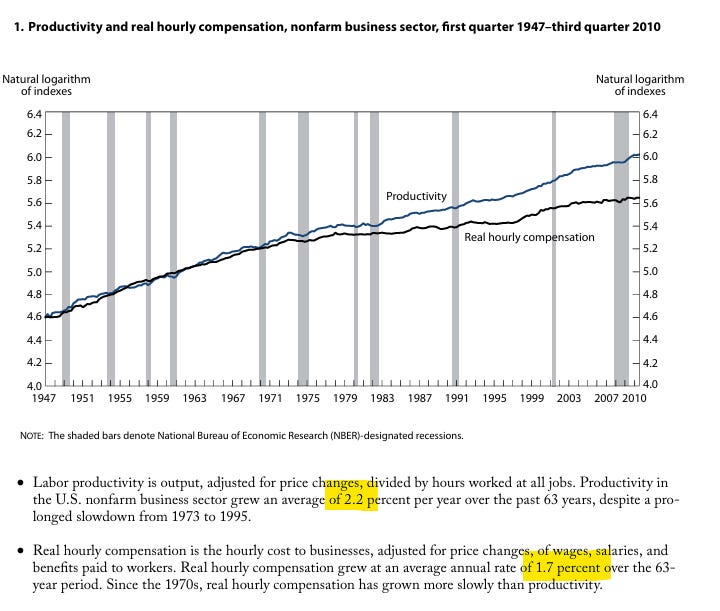
However, they also provide an explanation for why productivity seems to be outpacing compensation.
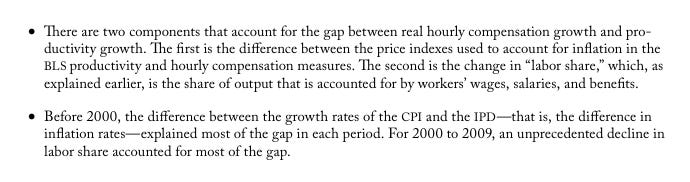
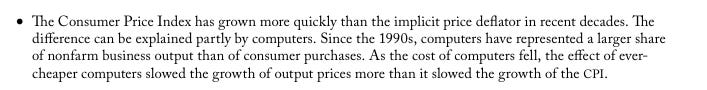
The first reason is the same as hours, the difference in how compensation and productivity is adjusted for inflation. Their reason for why there is a growing gap in the different inflation adjustment is also computers.
Their second reason for a growing gap of productivity and compensation is a drop in the labor’s share of income. In the early 2000 period the labor share had dropped, but it has also recovered in more recent times.

Given that the productivity compensation gap graph is so obviously fake it has been concerning to see right wing libertarians adopting it as a talking point to highlight that in 1971 we were taken off the gold standard. It is a valid concern, but there is no need to use a fake graph to bring attention to this fact. The strength of libertrains has been the fact that they have been economically literate and principled. I don’t want to see libertarians adopt the same gaslighting tricks of the progressives and conservatives.